The Passive Profit Matrix
We have had some requests from folks who want to play around with the numbers in Jay's Passive Profit Matrix spreadsheet, which he used to illustrate a point on a recent webinar training.
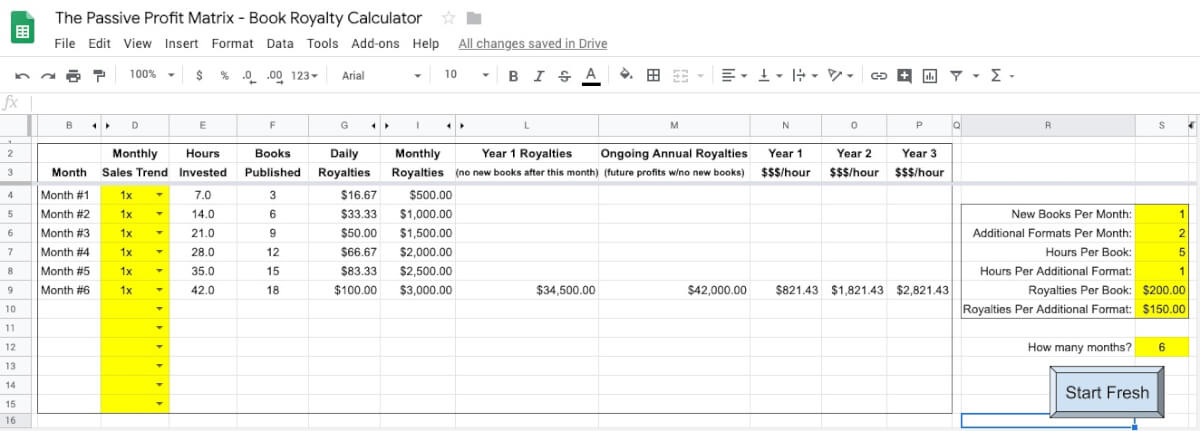
For a brief explanation of what is in the spreadsheet:
In column S, you enter your assumptions, namely how many new books per month you are going to create (and how many new formats of those books past the first one) and how much time each will take along with how much you expect to earn (on average) from each one. You can also specify how many months you will do this for between 1 and 12.
The box that makes up the majority of the spreadsheet will provide you with how much money you'll make each month and how much time you've invested in total work up to that point. The daily and monthly royalties are how much you would make in that particular month, while the Year 1 and Ongoing Annual Royalties will be totals for how much you'll make total that year assuming you stop creating new books in whichever month you specify. If you create new books and new formats for the first 5 months of the year, but then don't do anything else the rest of the year, the Year 1 Royalties will tell you how much you make the first year (when you slowly but steadily build up to 5 months worth of work) whereas the Ongoing Annual Royalties will let you know what you'd make every year after that assuming you create no new books (and includes all of your books for all 12 months, rather than cutting out the books that don't exist yet as would be the case in year 1.) You can also see how much money you earned per hour after each of the first 3 years based on how much time you spent creating those books and each format.
The only other customizable piece of information is in column D, where you can specify the monthly sales trend for a specific month. For example, November and December often have higher sales than other months, and depending on what niche or genre you write in you may find that sales slow down a little in the Summer months. You can account for those trends by choosing a multiplier for that month in column D.
You can click the link below and use it as is, or you can copy it into your own Google Drive account or download as an excel file. Note that if you use the original file, you can only edit the fields in yellow and that the “Start Fresh” script will probably not run (all it does is delete the contents of the yellow boxes in column S anyway, so you won't be missing out on much.
This is for Apex Authors
JOIN NOW FOR FREEApex Authors is the premier online community of modern independent publishers in the world. Become an Apex Author today and get access to all of our training and archives, as well as our proprietary software tools to help you publish and sell your books!
Already an Apex Author? Click here to sign in.